
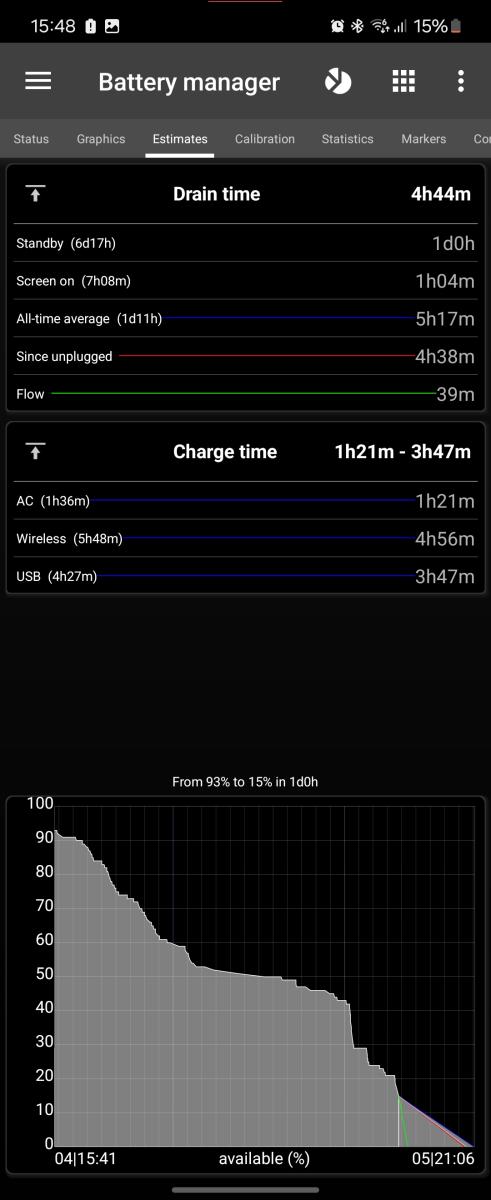
This screen, part of Battery Manager, shows estimated run-time based on learned usage pattern.
This require battery history to be recorded.
Tap on the remaining times to switch from remaining time (duration) and estimated time (precise date/time).
Tap on graphic to switch between average, since (un)plug and (dis)charge estimates.
Estimated Times
- Global estimates in blue is based on the average times below.
- Since last (un)plug in red is based on the average since (un)plugged using last measure below.
- Actual (dis)charge in green is based on mA charge or consumption.
- Standby shows how long device will last in standby (screen’s turned off). Total time is in parenthesis (from 100% to 0%);
- Screen-on shows how long device will last while screen is turned on. Total time is in parenthesis (from 100% to 0%);
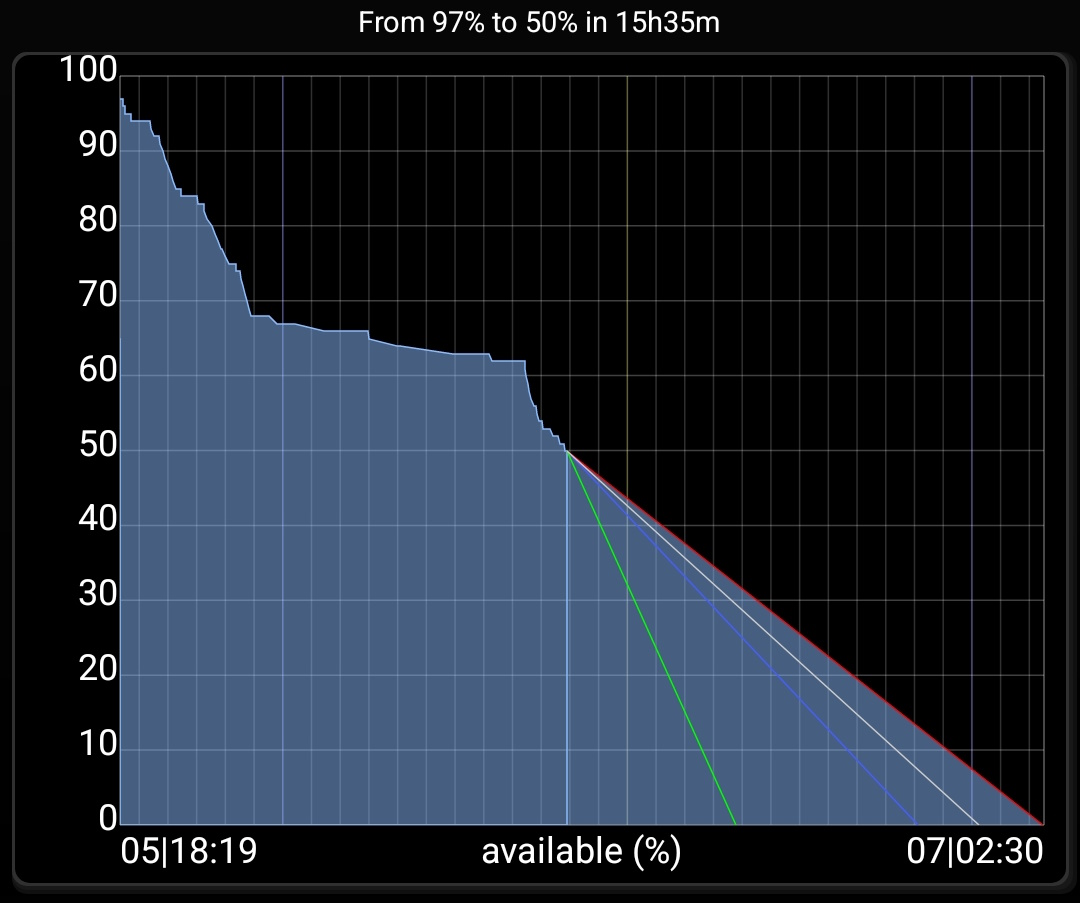
Graphic
This shows the last few hours and the 5 estimates produced.
Tap the graphic to switch the focus from on estimate to the other in loop.
Widget (global estimates)
You can use the graphic estimates in a widget on your launcher! When selecting ‘global estimates’ in ‘battery estimates’ group, you will see 4 estimated line as follows:
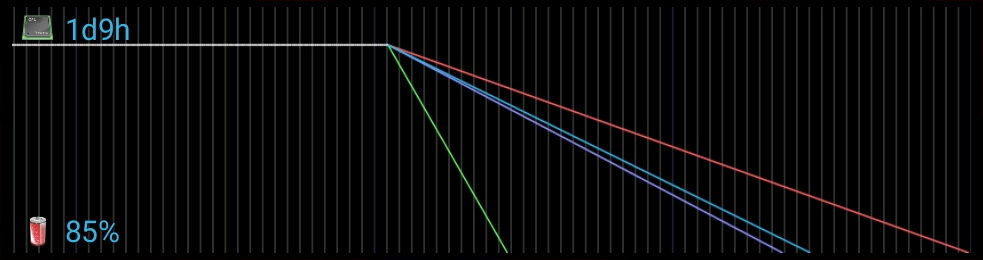
Global shows a graph with multiple lines, green, blue, purple and red.
- Blue line is global average based on all historical data.
- Green line (or real-time) shows remaining time based on actual mA.
- Red (or current estimates) shows average since last (un)plug.
- Purple (or average estimates) is the pondered average between blue line and red line, eg the closer to 0% the closer the purple is to the red