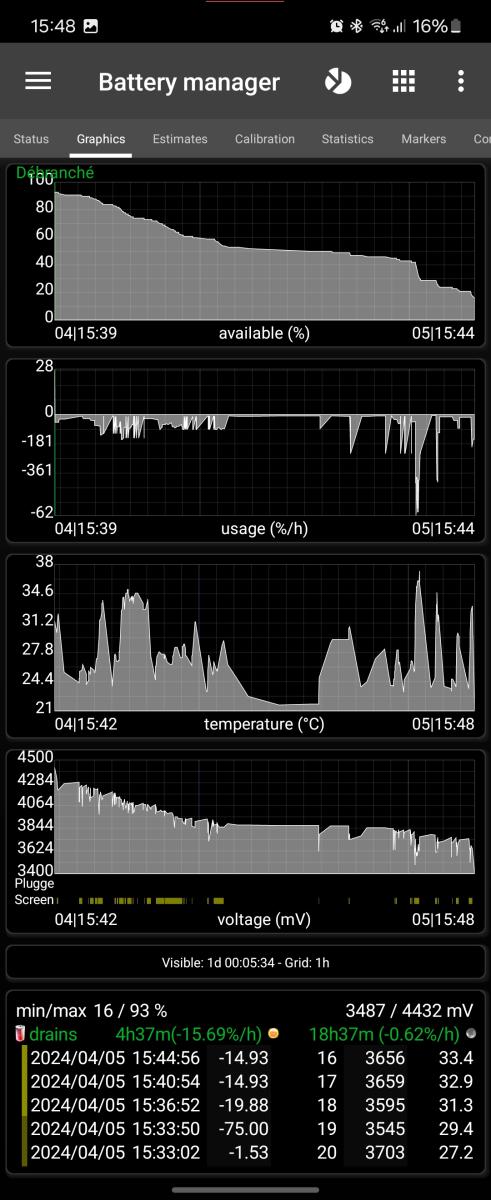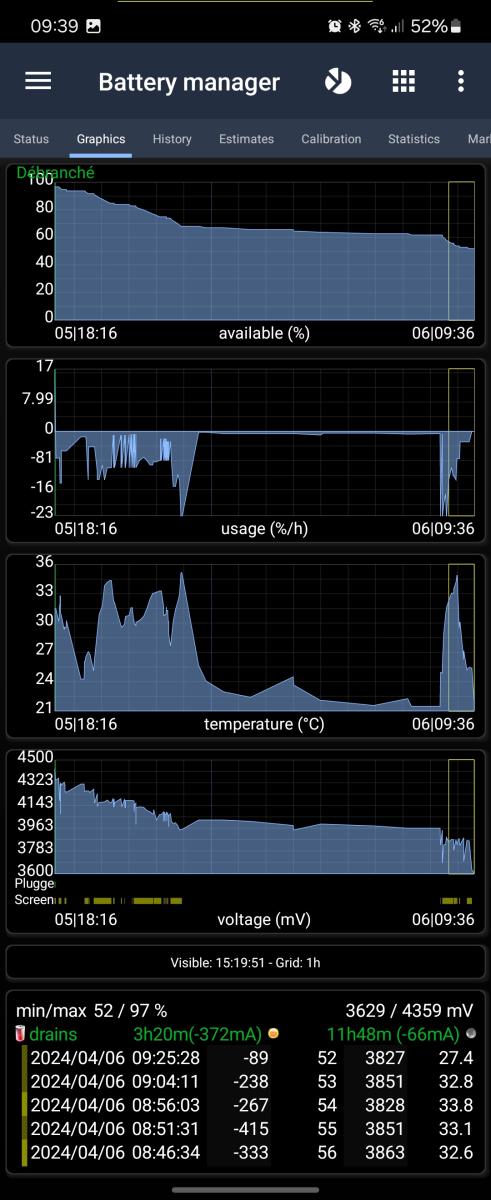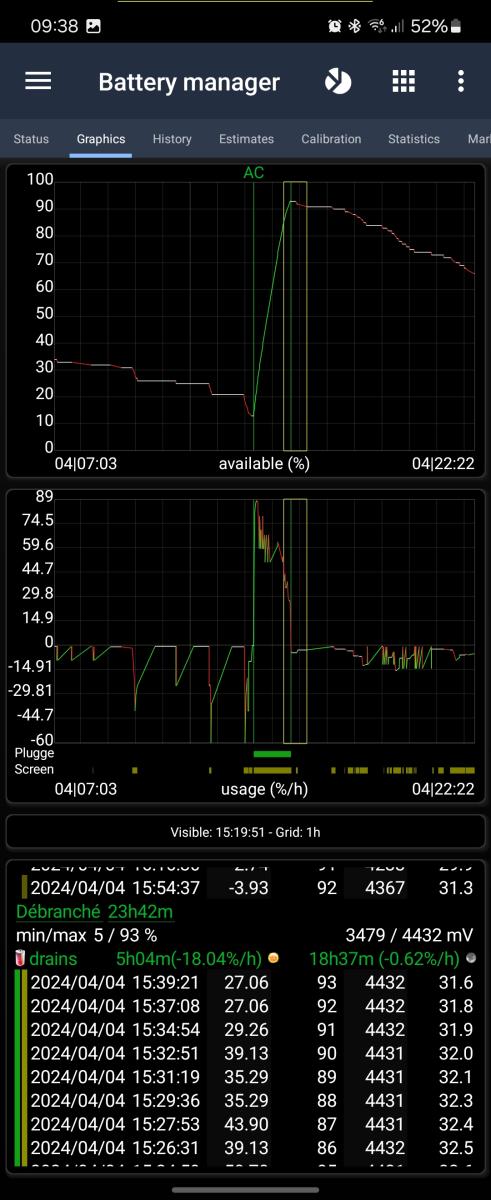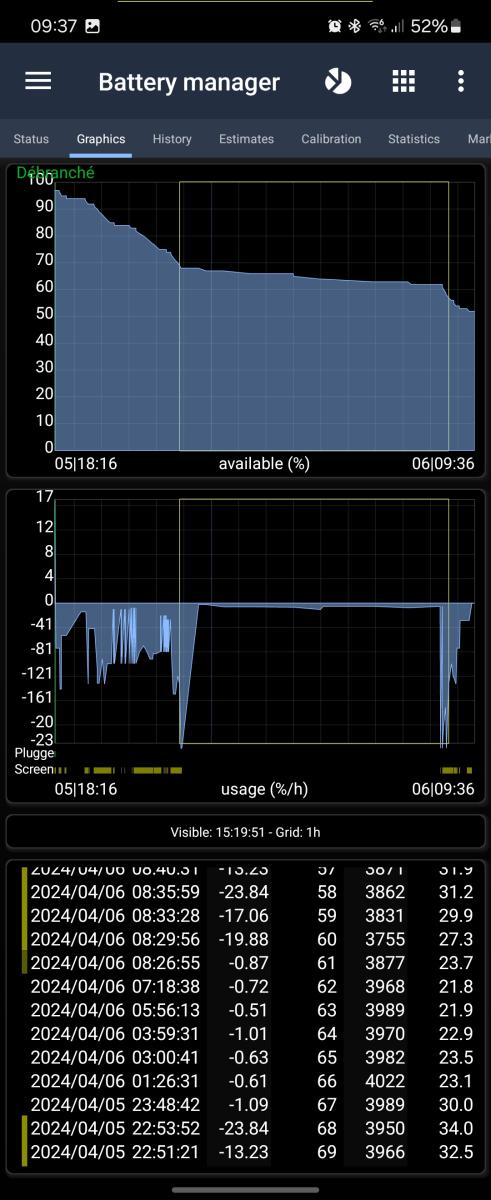
This screen, part of Battery Manager, shows one, two or four graphics of recorded data. At the bottom you can see the plug and screen states.
It can optionnally show text history, linked to visible graphic history.
Tap a graphic (in on-two graphics mode) to switch its data cycling through all data: %, %/h, mV, mW, mA and temperature.
Long-press a graphic for additional options:
- Switch a graphic min/max calculation between visibile and global
- Select length of view
- Select predefined view (since unplugged being my favotire)
- Display text history as detailed here.
- Switch from theme color or red/green/white color graphics.
When using color-coded graphics, the following colors are used:
- Green – AC charging, increasing
- White – Flat
- Red – Discharging or decreasing
- Blue – USB Charging
- Red – Wireless charging